For this lab assignment we learned about 5 differnt map styles, specifically choropleth maps, dot density maps, proportional symbol maps, isopleth maps, and environmental sensitivity index maps. I have provided examples of each map style below.
Choropleth Map: A choropleth map displays data with shading or patterns in proportion to the measurement of the statistical variable being displayed on the map.
Dot Density Map: A dot density map shows information with dots where each dot represents a specific unit quantity.
Proportional Symbol Map: A proportional symbol map uses varying sizse of a specific symbol to represent data associated with different areas or locations on the map.
Isopleth Map: An isopleth map uses lines to show variation in value. There are two types of isopleth maps, topographic and bathymetric maps. A topographic map uses contour lines to show relief features in the earth's surface.
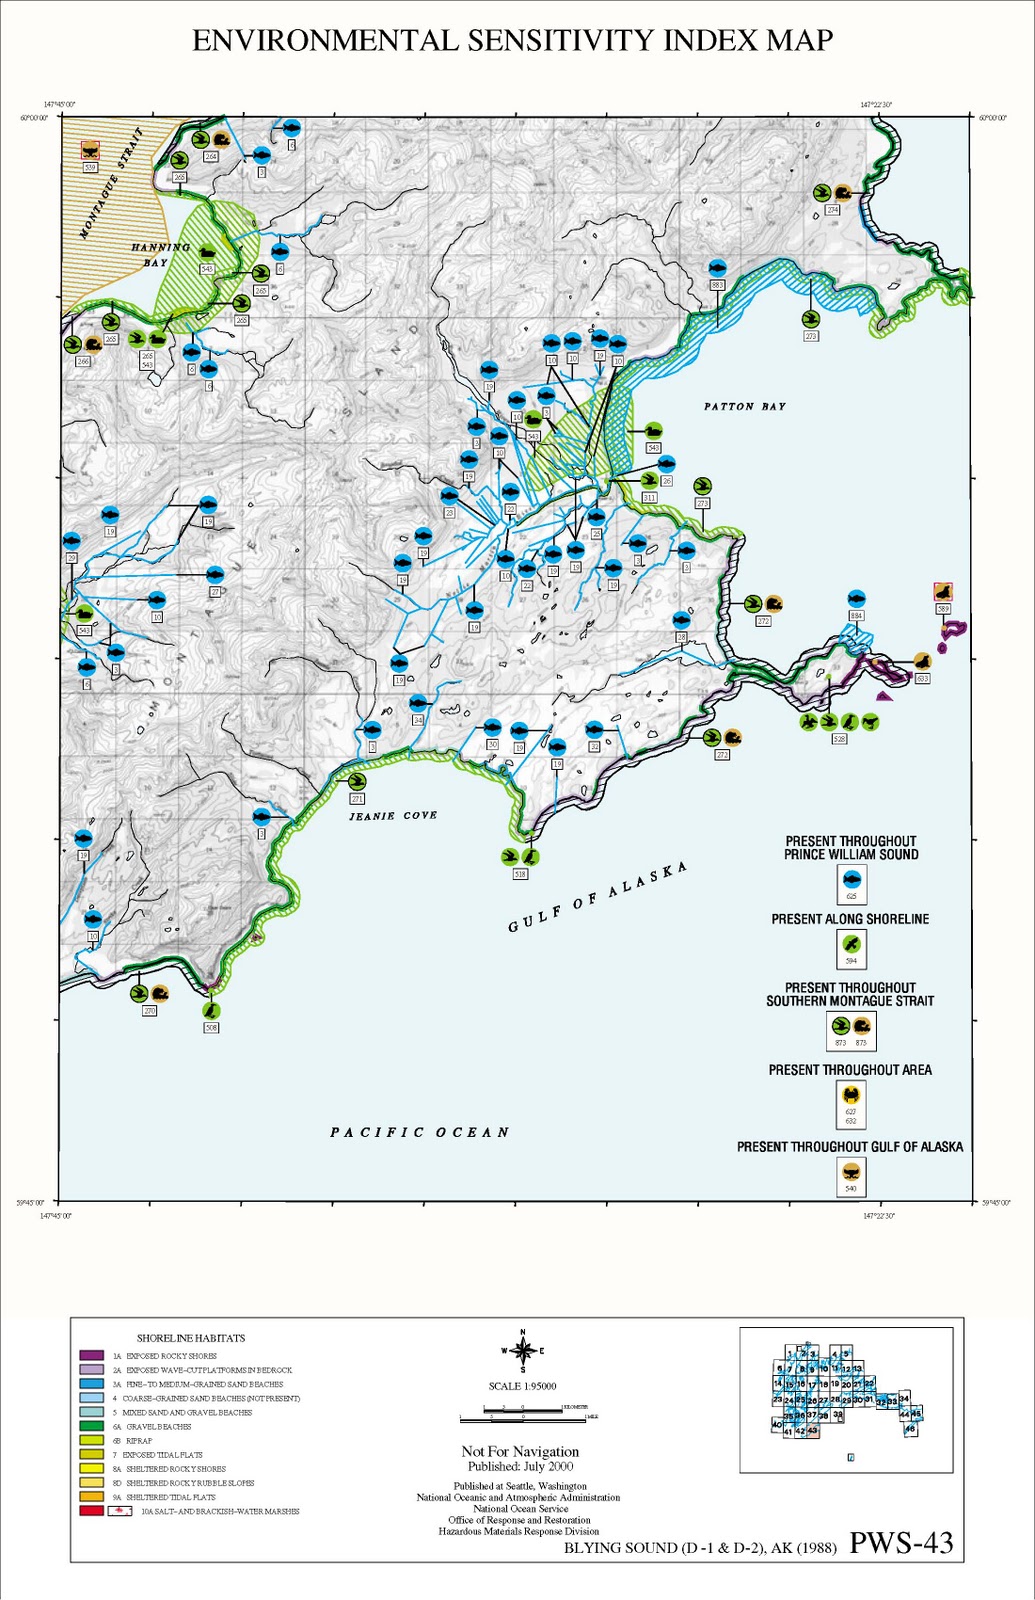
Environmental Sensitivity Index Map (ESI): ESI maps are used as a quick reference for oil and chemical spill responders because they show color coded shorelines, sensitive biological resources and sensitive human-use resources.
Hurricane Isaac Hits Louisiana Weather Radar